

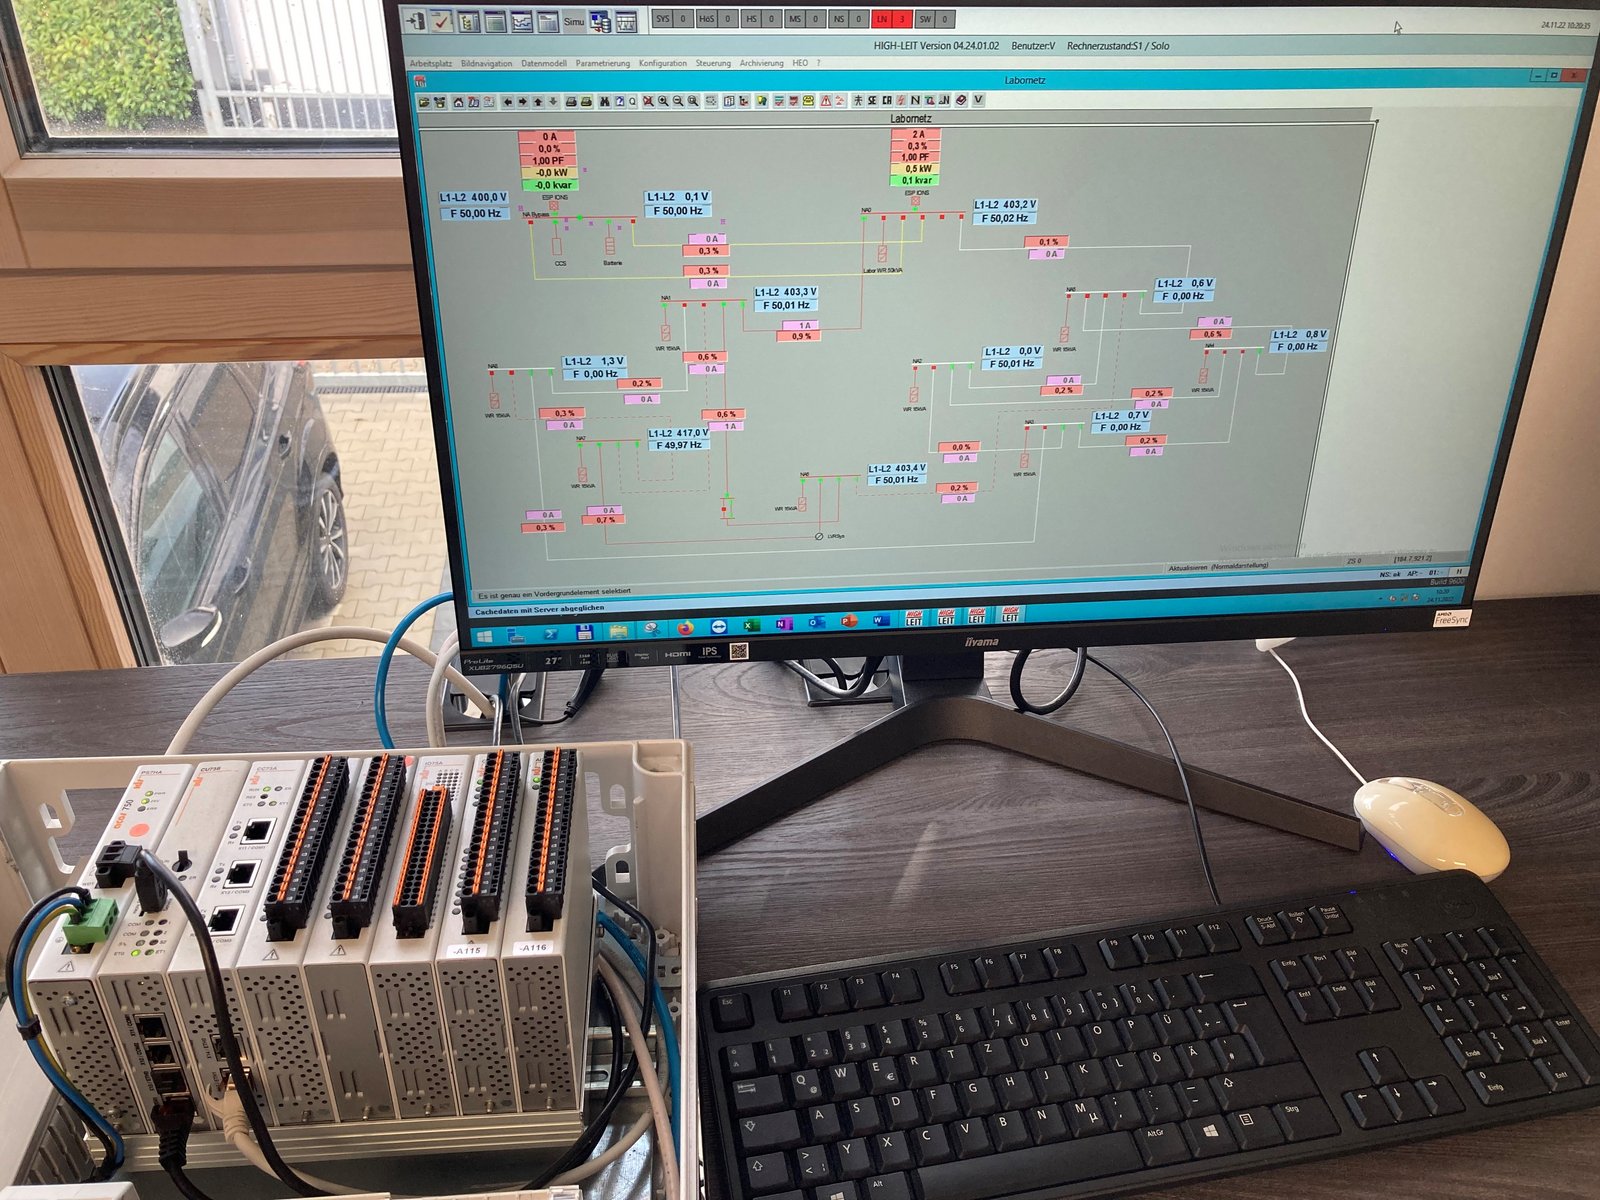
The laboratory's low-voltage grid can be divided into four grid types: rural, village, suburban and urban, and seven topologies have been designed for this purpose. The individual load curves can be composed of different components: different base load consumptions, configurable PV systems, with and without battery storage, a heat pump and a charging station. The topologies can be switched from the control center. The Acos750 telecontrol unit (on the left in the picture) receives all data from the telecontrol units and passes them on to the control center. There, the measurements are displayed, logged and archived.
Scenarios in the control center
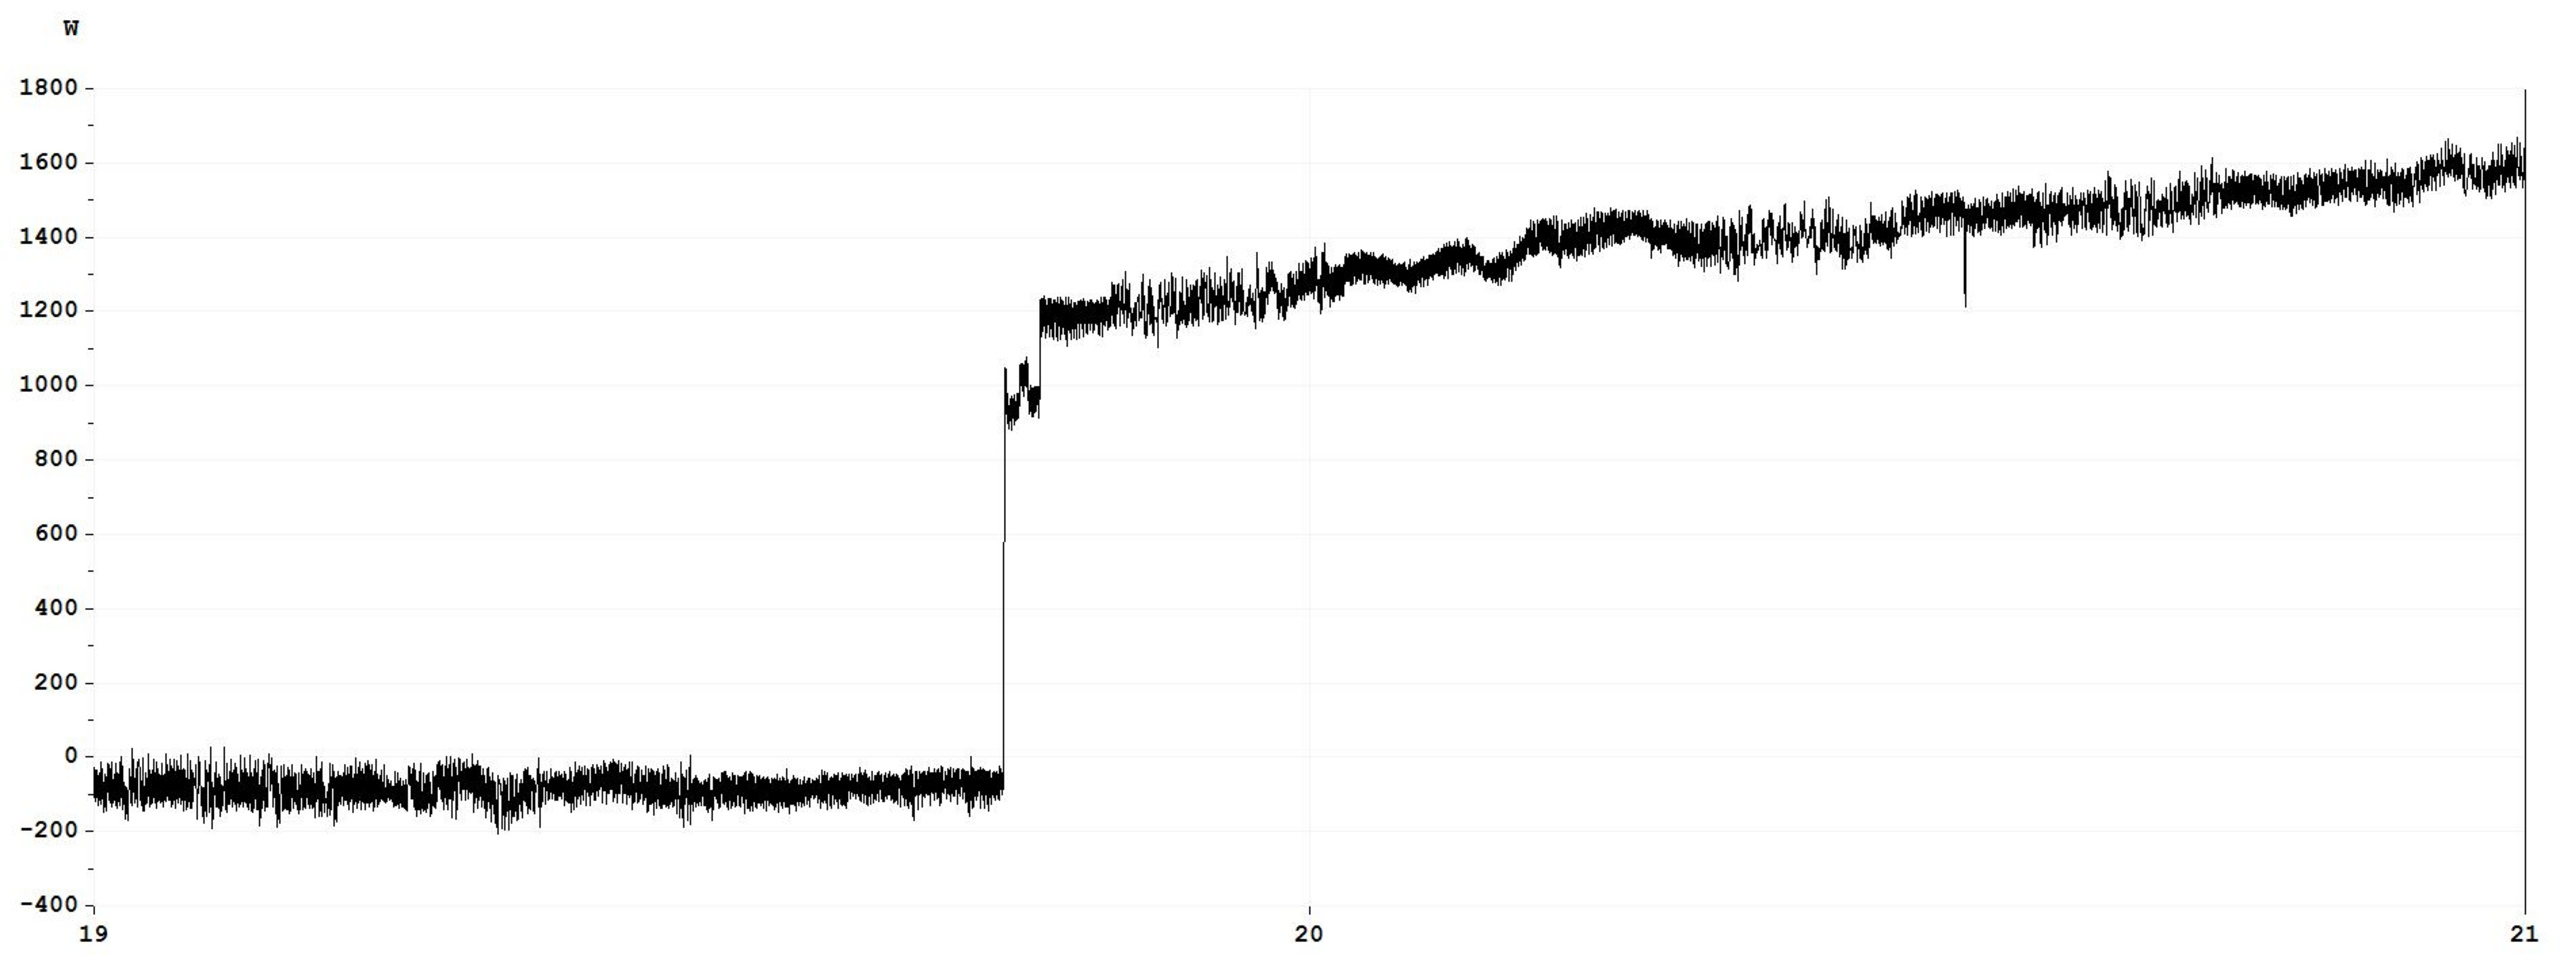
We started with topology 1 "Country 1". The picture shows an example of a measurement over two hours. You can see a jump in the load curve, before that the battery storage was charged with PV electricity, after that the PV electricity was fed in again and the power increases.
After "Country 1" another 6 topologies will be tested: Country 2, Village 1 + 2, Suburb 1 + 2 and City.
The Hessian municipalities can be clearly identified according to their municipal codes. In order to represent the state in a meaningful way, the Hessian municipal statistics were used to weight the individual municipalities based on their population-workplace density and to assign them to an agglomeration area. This allows data sets from Hesse to be clearly divided into the laboratory topologies of rural, village, suburban and urban. The focus in creating the energy scenarios was on the technical implementation of the energy policy goals at the distribution grid level.